plots
This module provides functions related to plot or to plot data.
|
Center a diverging colorbar. |
|
Plot instrument channels for passband-type sensors. |
|
Export colormap to Adobe Color Table file. |
|
Export colormap ass CSS3 gradient. |
|
Export colormap to cpt file. |
|
Export colormap as GIMP gradient. |
|
Convert a colormap into a list of RGBA values. |
|
Export colormap to txt file. |
|
Import colormap from Adobe Color Table file. |
|
Import colormap from txt file. |
|
Plot a colorized series of bars. |
|
Create a colormap from a list of given colors. |
|
Return a figure size matching the golden ratio. |
Get efficient (nrow, ncol) for n subplots |
|
|
Return material design colors. |
|
Plot a heatmap of two data arrays. |
Creates hectopascal labels for pascal input. |
|
|
Creates logarithmic hectopascal labels for pascal input. |
|
Walks through axes and labels each. |
|
Plot a bitfield of categories with pcolor |
|
Plot the distribution of y vs. |
|
Plot atmospheric profile against pressure in linear space. |
|
Plot atmospheric profile against pressure in log space. |
|
Plot atmospheric profile of arbitrary property against height (in km). |
|
Provide a ticklabel formatter that applies scaling. |
|
Plot a scatter density plot matrix |
|
Set colorbar limits. |
|
Set given formatter for major and minor xticks. |
|
Set given formatter for major and minor yticks. |
|
Sort legend labels and handles. |
Handle matplotlib stylesheets shipped with typhon. |
|
|
Create a common colorbar for all subplots in a figure. |
|
Return the ARTS Ppath plotted on the surface |
|
Return the ARTS Ppath plotted on the surface |
|
Return the minimum and maximum of all pos variables of ppath_field |
|
Adjusts the axis of plotted ppath_field to |
Plots the zenith angle coverage of a ppath_field for all the altitudes in the field. |
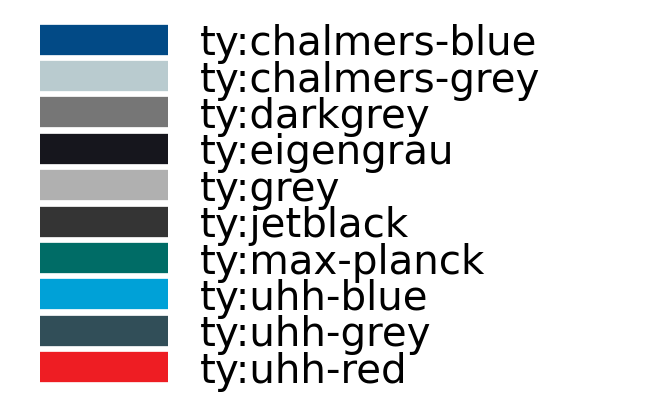
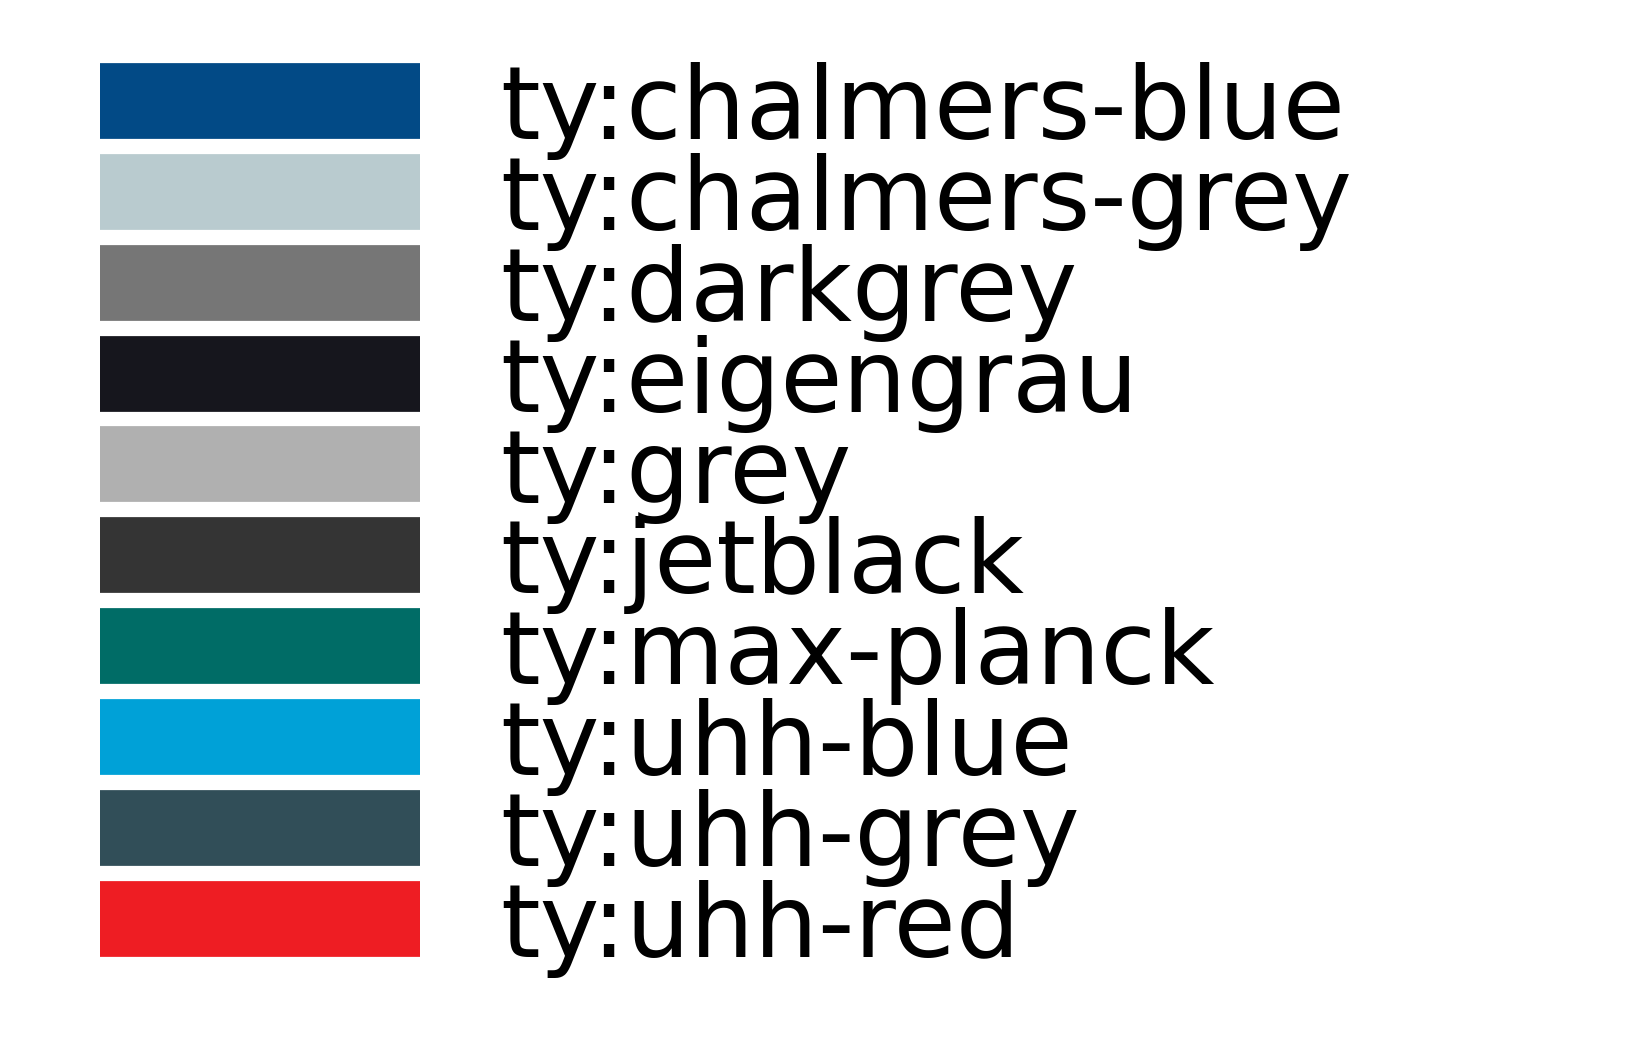
Typhon named colors
Typhon provides a number of named colors that can be used after importing
typhon.plots:
>>> plt.plot(x, y, color='ty:uhh-red')
(Source code, png, hires.png, pdf)

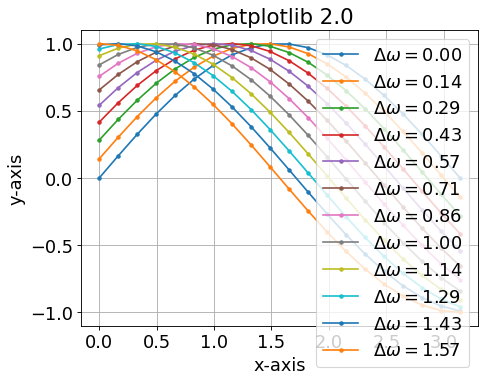
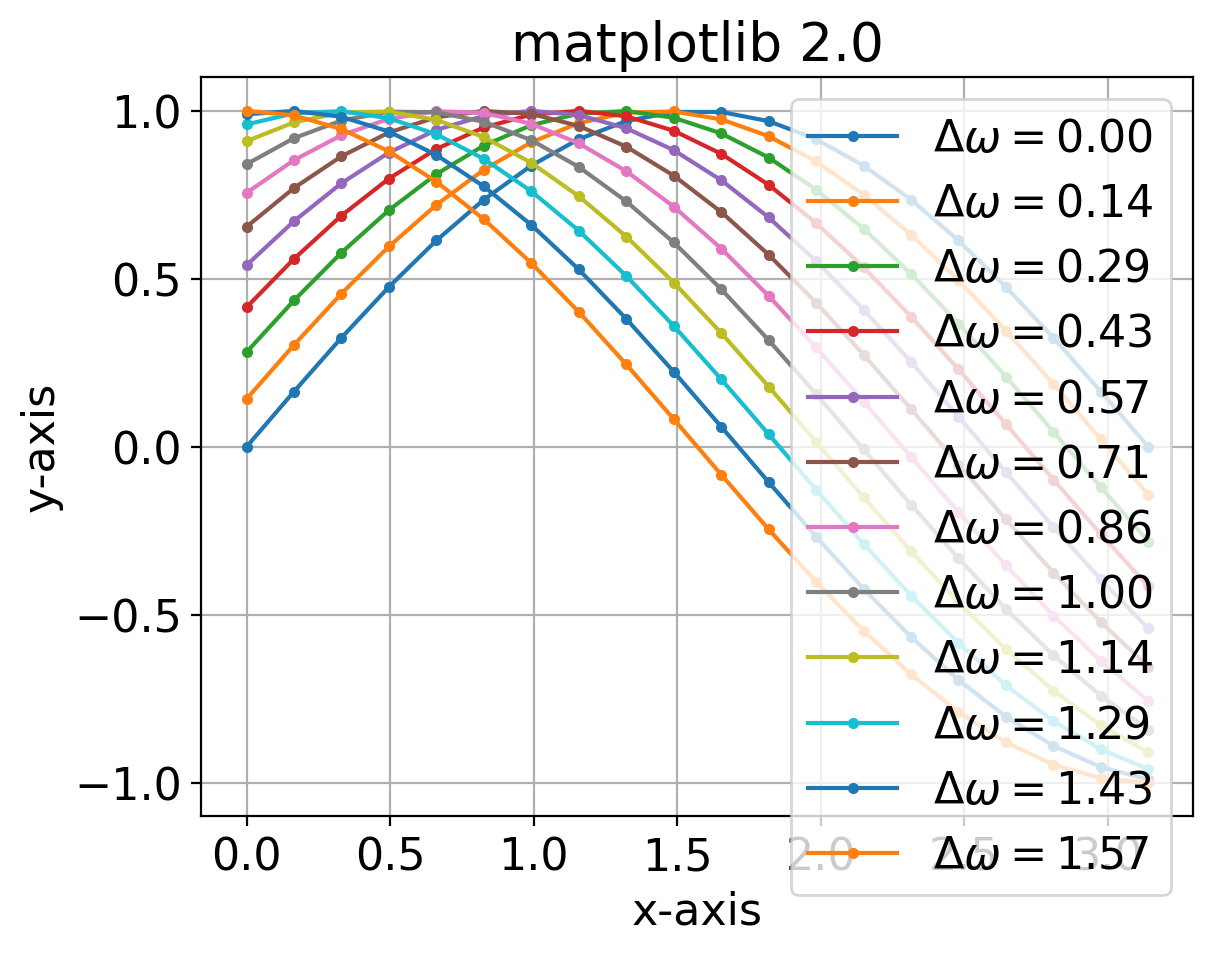
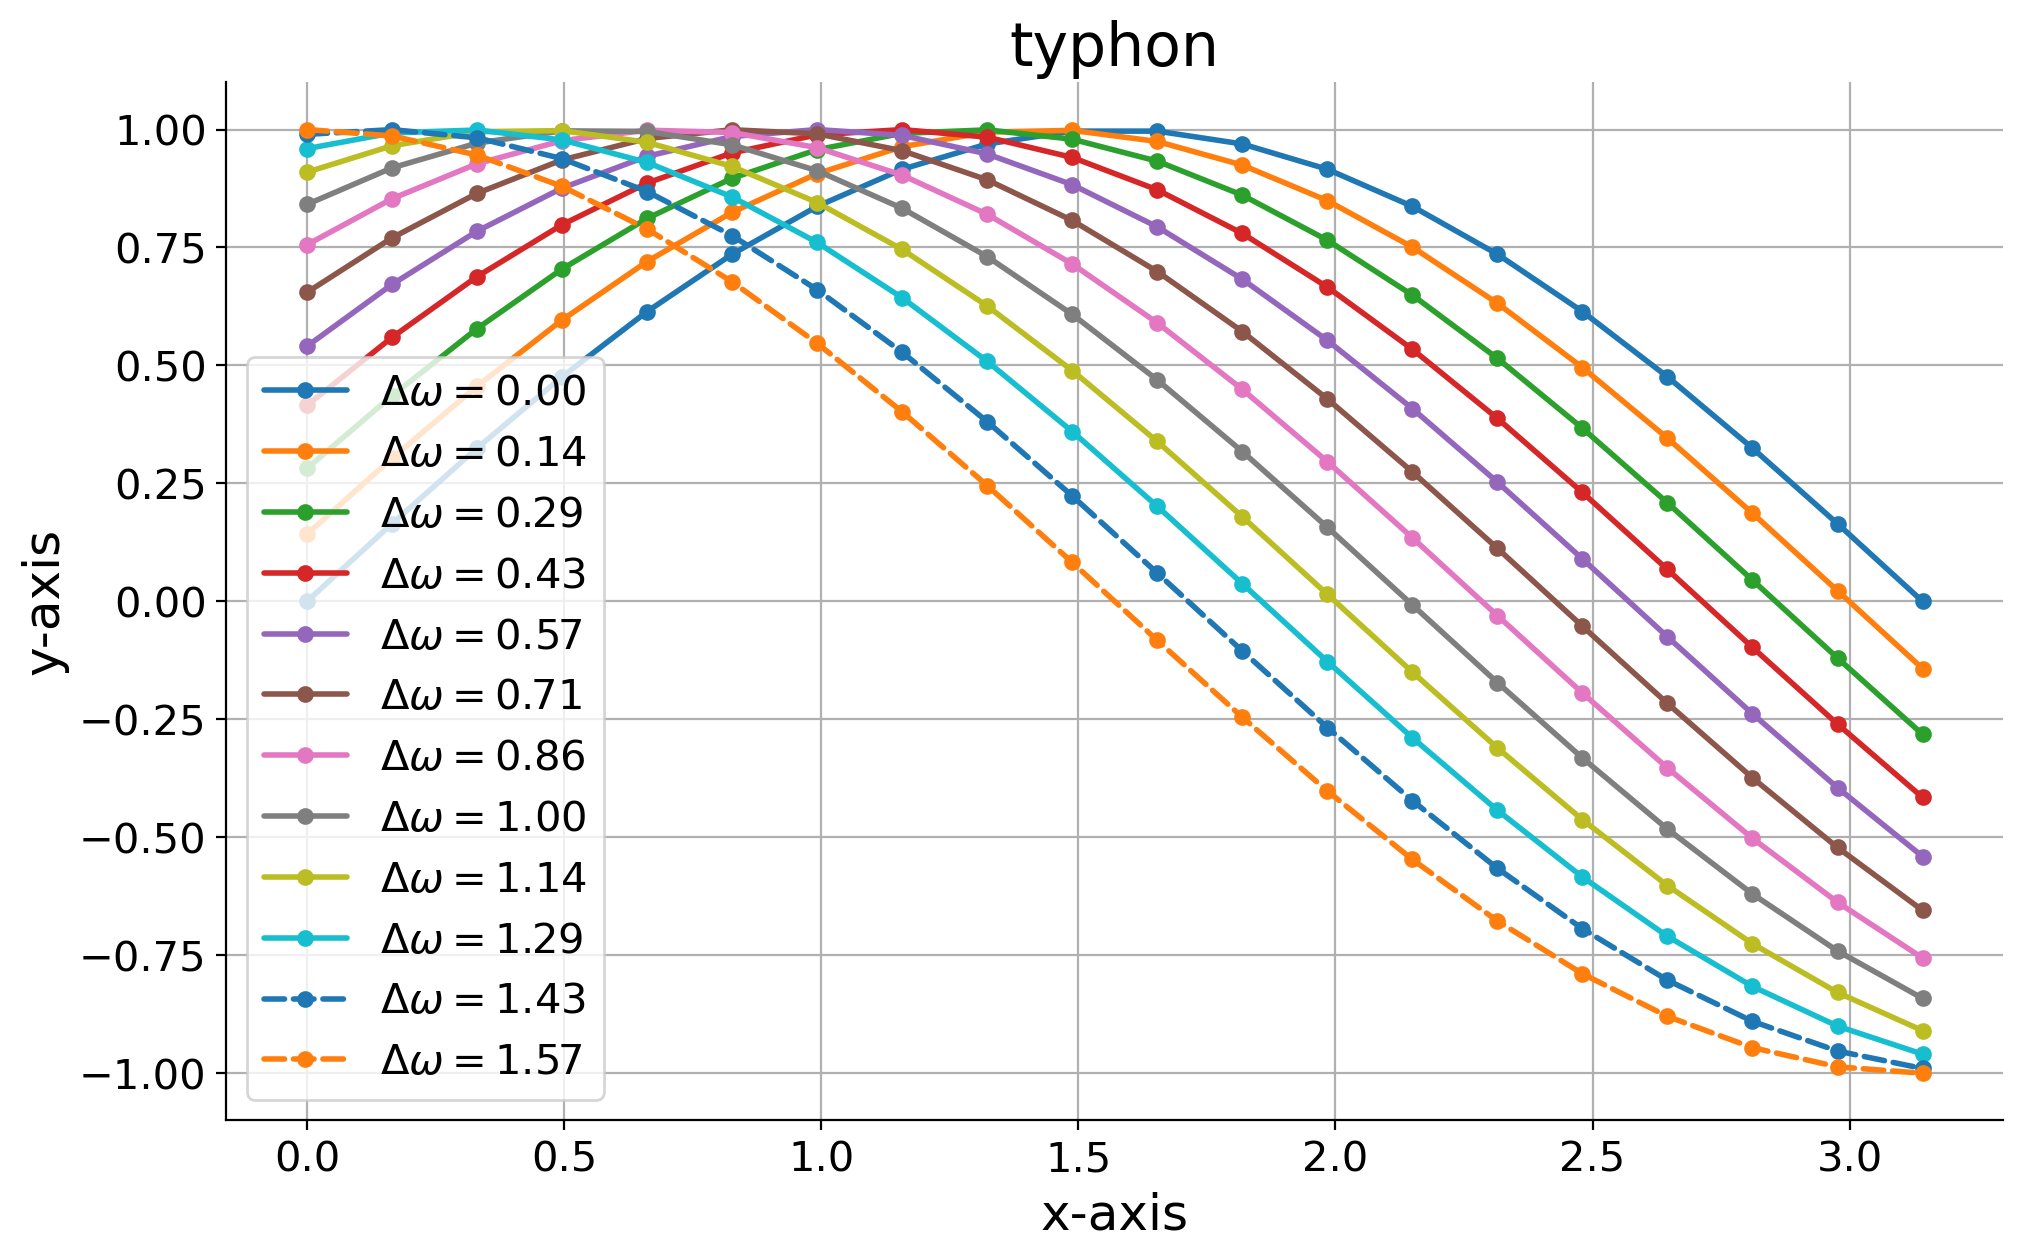
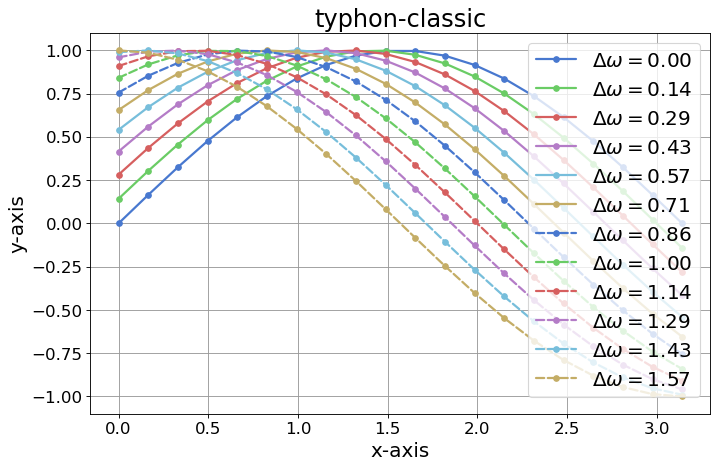
Typhon style sheet
Typhon provides a number of style sheets that can be used to alter the default appearance of matplotlib plots.
>>> plt.style.use(typhon.plots.styles.get('typhon'))


