plots.cm
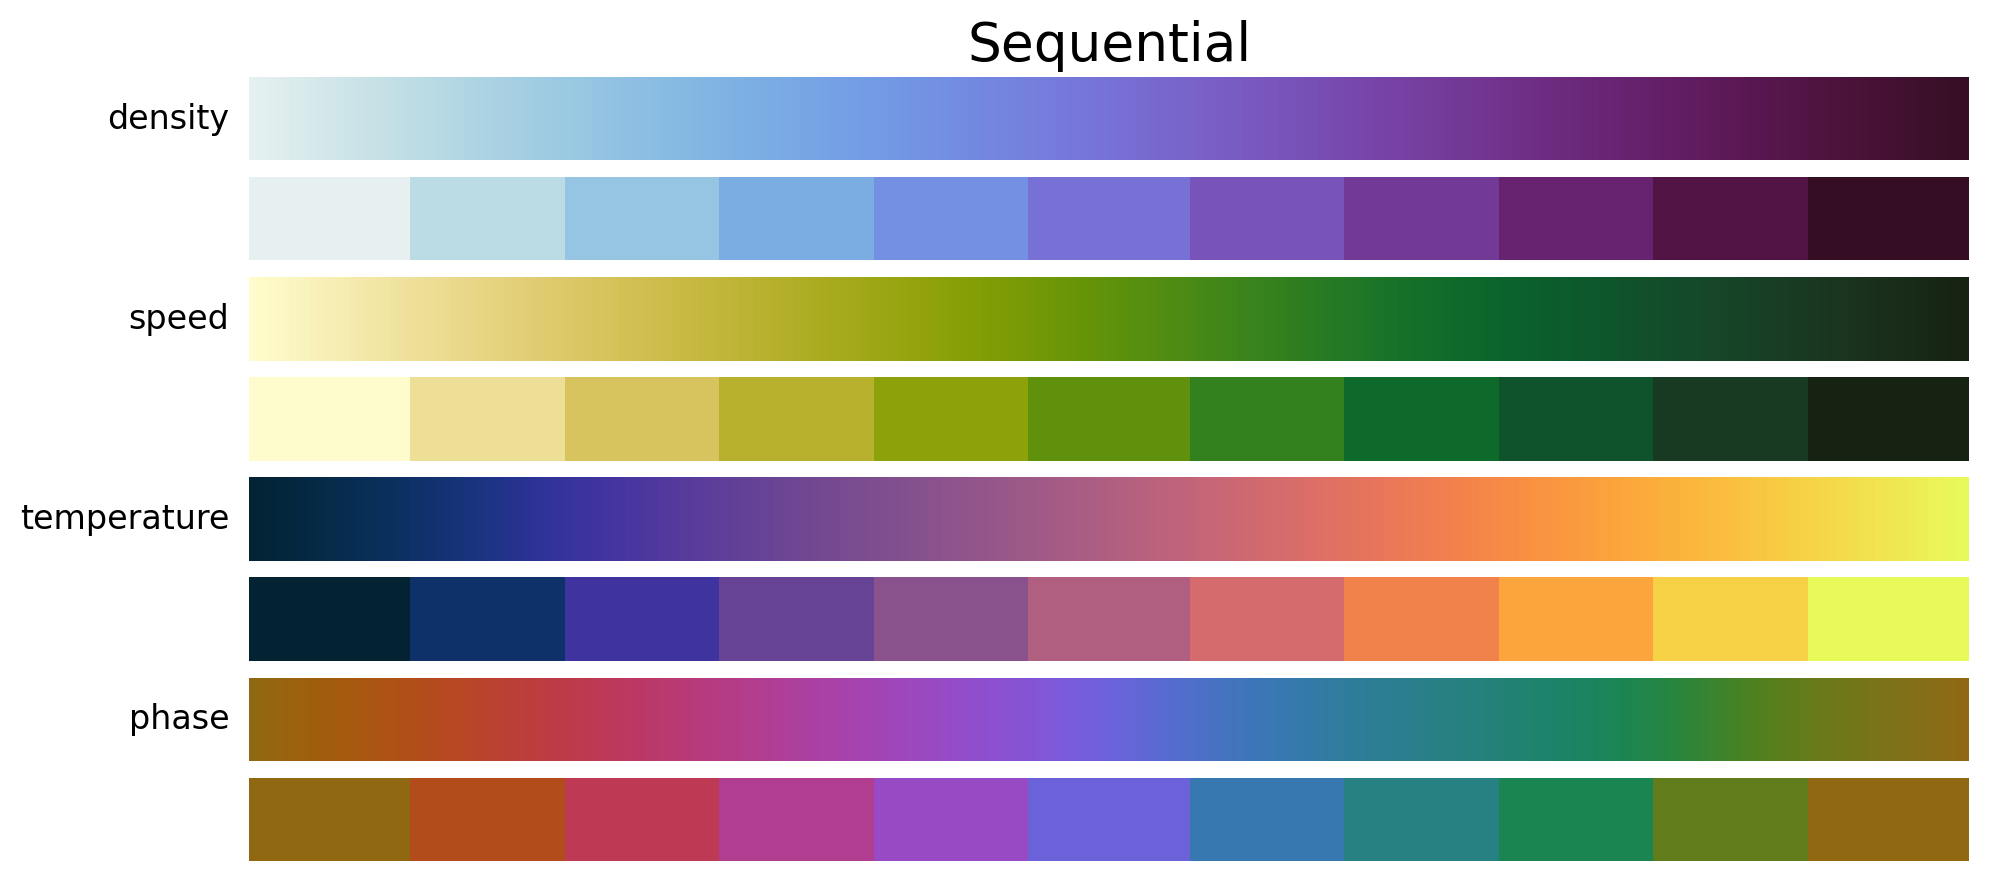
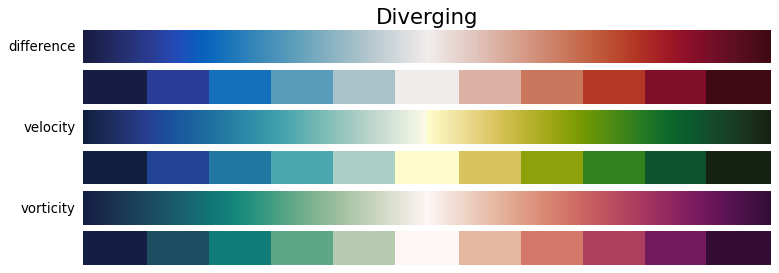
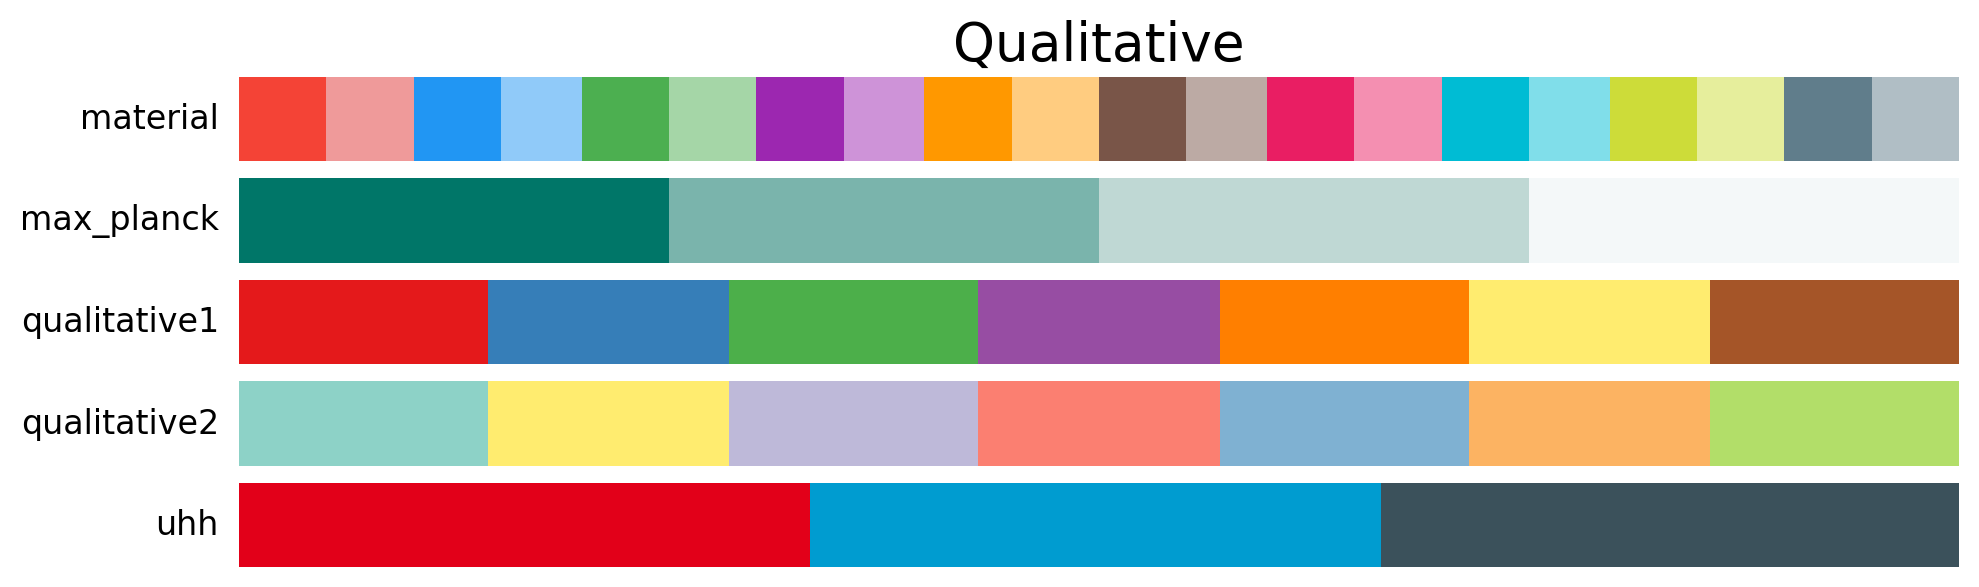
This module provides colormaps to use for the visualisation of meteorological data. It heavily bases on the cmocean package developed by Kristen Thyng. Most colormaps are directly inherited and renamed for meteorological applications.
The colormaps are registered in matplotlib after importing typhon:
>>> import typhon
>>> plt.get_cmap('difference')
Example gallery
Typhon Colormaps


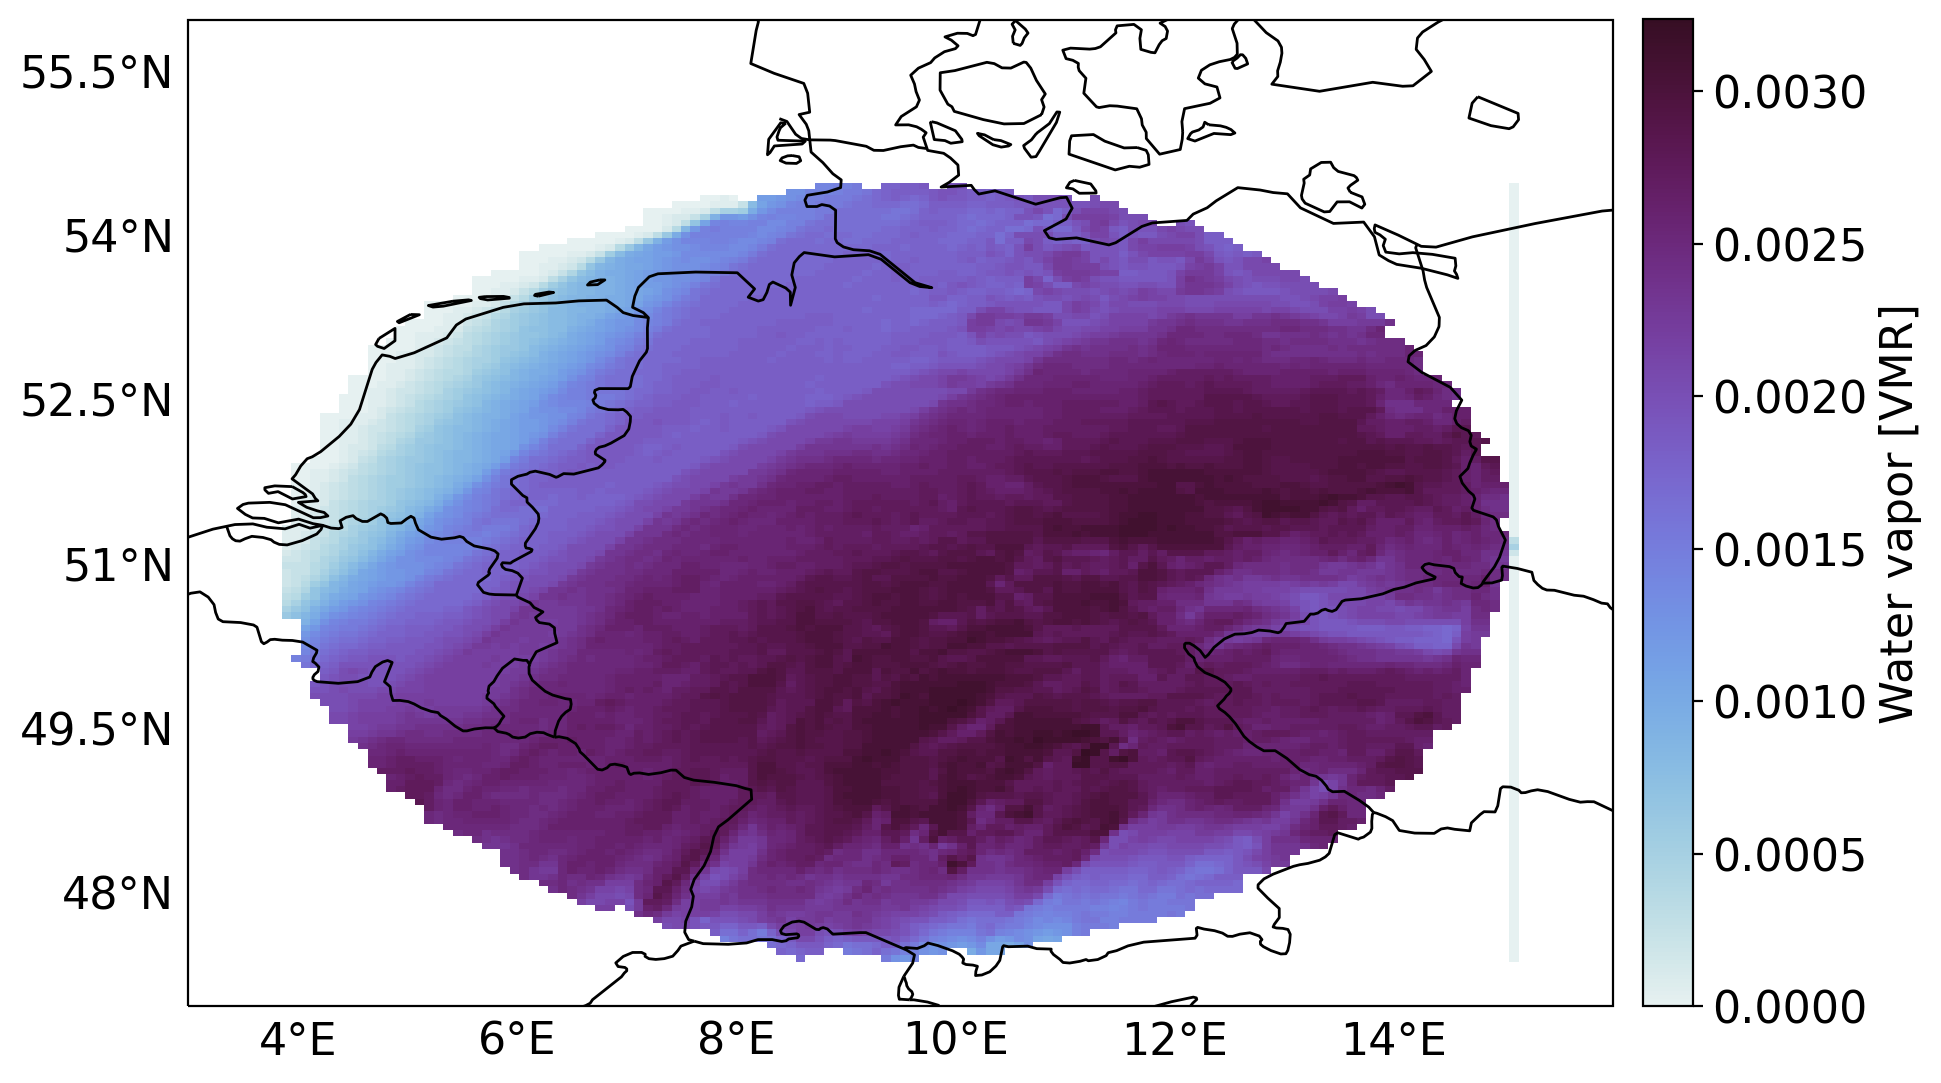
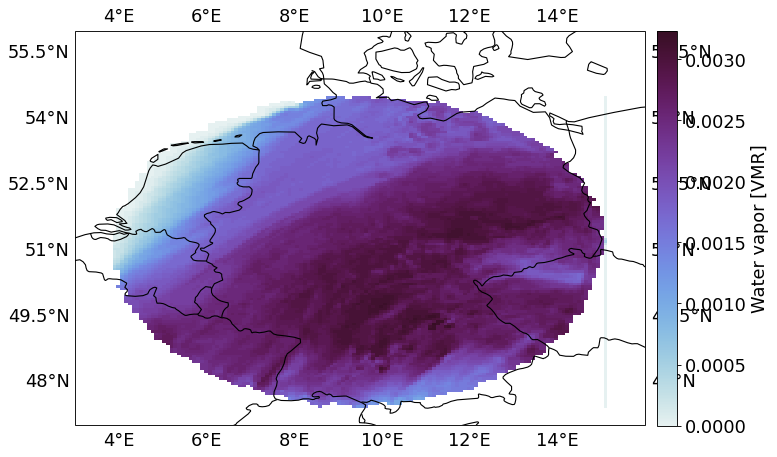
Density
# -*- coding: utf-8 -*-
"""Plot to demonstrate the density colormap. """

import matplotlib.pyplot as plt
import netCDF4
import numpy as np
import cartopy.crs as ccrs
from cartopy.mpl.gridliner import (LONGITUDE_FORMATTER, LATITUDE_FORMATTER)

from typhon.plots.maps import get_cfeatures_at_scale


# Read air temperature data.
with netCDF4.Dataset('_data/test_data.nc') as nc:
    lon, lat = np.meshgrid(nc.variables['lon'][:], nc.variables['lat'][:])
    h2o = nc.variables['qv'][:].astype('float64')

# Create plot with PlateCarree projection.
fig = plt.figure(figsize=(10, 8))
ax = fig.add_subplot(111, projection=ccrs.PlateCarree())
ax.set_extent([3, 16, 47, 56])

# Add map "features".
features = get_cfeatures_at_scale(scale='50m')
ax.add_feature(features.BORDERS)
ax.add_feature(features.COASTLINE)

# Plot the actual data.
sm = ax.pcolormesh(lon, lat, h2o,
                   cmap='density',
                   rasterized=True,
                   transform=ccrs.PlateCarree(),
                   )
fig.colorbar(sm, label='Water vapor [VMR]', fraction=0.0328, pad=0.02)

# Add coordinate system without drawing gridlines.
gl = ax.gridlines(draw_labels=True, color='none')
gl.xformatter, gl.yformatter = LONGITUDE_FORMATTER, LATITUDE_FORMATTER
gl.xlabels_top = gl.ylabels_right = False

fig.tight_layout()
plt.show()
(Source code, png, hires.png, pdf)
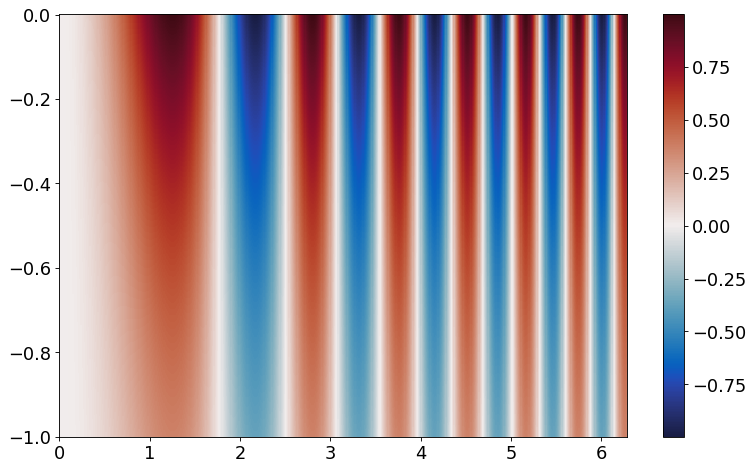
Difference
# -*- coding: utf-8 -*-

"""Plot to demonstrate the difference colormap.
"""

import numpy as np
import matplotlib.pyplot as plt

from typhon.plots import (figsize, cmap2rgba)


x = np.linspace(0, 2 * np.pi, 500)
y = np.linspace(0, -1, 500)[:, np.newaxis]
z = np.sin(x**2) * np.exp(y)

fig, ax = plt.subplots(figsize=figsize(10))
ax.set_prop_cycle(color=cmap2rgba('qualitative1', 7))
sm = ax.pcolormesh(x, y, z, cmap='difference', rasterized=True)
fig.colorbar(sm)

fig.tight_layout()
plt.show()
(Source code, png, hires.png, pdf)
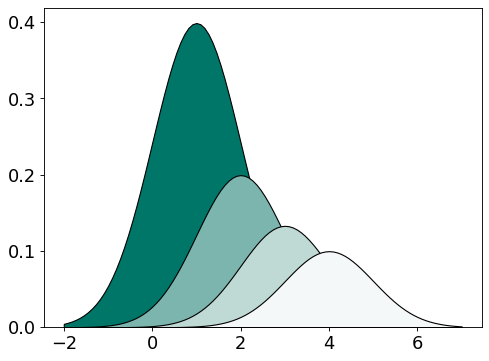
Max-Planck
# -*- coding: utf-8 -*-
"""Plot to demonstrate the Max Planck color palette (Pantone 328).
"""

import matplotlib.pyplot as plt
import numpy as np
from scipy.stats import norm

from typhon.plots import cmap2rgba


x = np.linspace(-2, 7, 100)

fig, ax = plt.subplots()
ax.set_prop_cycle(color=cmap2rgba('max_planck'))
for i in range(1, 5):
    ax.fill_between(x, norm.pdf(x, loc=i) / i, edgecolor='black')
ax.set_ylim(bottom=0)

fig.tight_layout()
plt.show()
(Source code, png, hires.png, pdf)

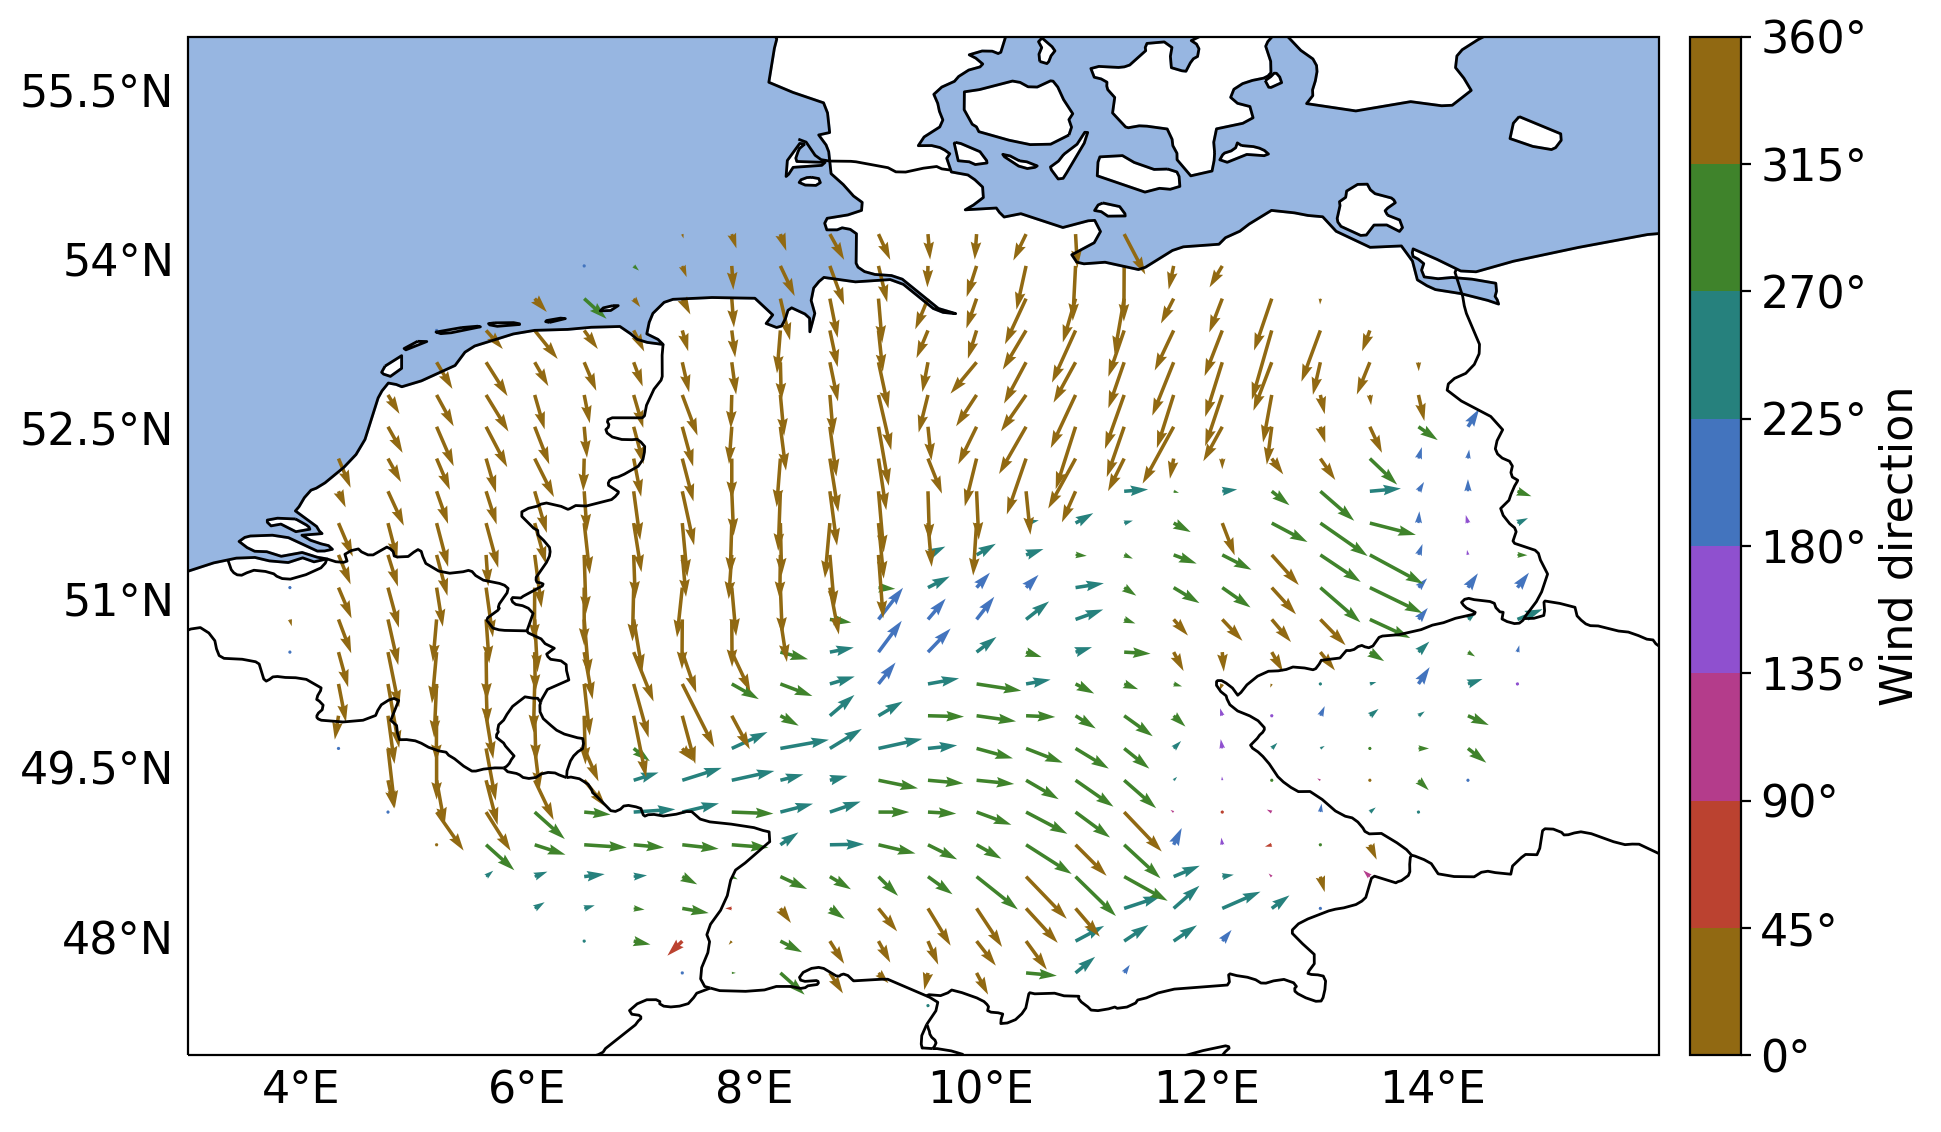
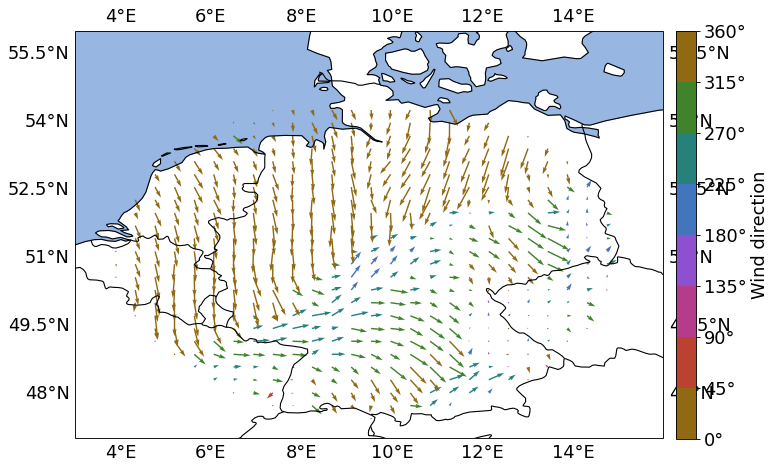
Phase
# -*- coding: utf-8 -*-
"""Plot to demonstrate the phase colormap. """

import matplotlib.pyplot as plt
import netCDF4
import numpy as np
import cartopy.crs as ccrs
from cartopy.mpl.gridliner import (LONGITUDE_FORMATTER, LATITUDE_FORMATTER)
from matplotlib.ticker import FuncFormatter

from typhon.plots.maps import get_cfeatures_at_scale


@FuncFormatter
def degree_formatter(x, pos):
    """Create degree ticklabels for radian data."""
    return '{:.0f}\N{DEGREE SIGN}'.format(np.rad2deg(x))


# Read wind data.
with netCDF4.Dataset('_data/test_data.nc') as nc:
    nth = 5
    lon, lat = np.meshgrid(nc.variables['lon'][::nth],
                           nc.variables['lat'][::nth])
    u, v = nc.variables['u'][::nth, ::nth], nc.variables['v'][::nth, ::nth]

wdir = np.arctan2(u, v) + np.pi

# Create plot with PlateCarree projection.
fig = plt.figure(figsize=(10, 8))
ax = fig.add_subplot(111, projection=ccrs.PlateCarree())
ax.set_extent([3, 16, 47, 56])

# Add map "features".
features = get_cfeatures_at_scale(scale='50m')
ax.add_feature(features.BORDERS)
ax.add_feature(features.COASTLINE)
ax.add_feature(features.OCEAN)

# Plot the actual data.
sm = ax.quiver(lon, lat, u, v, wdir,
               cmap=plt.get_cmap('phase', 8),
               transform=ccrs.PlateCarree(),
               )

# Add custom colorbar for wind directions (e.g. tick format).
cb = fig.colorbar(sm, label='Wind direction', format=degree_formatter,
                  fraction=0.0328, pad=0.02)
cb.set_ticks(np.linspace(0, 2 * np.pi, 9))

# Add coordinate system without drawing gridlines.
gl = ax.gridlines(draw_labels=True, color='none')
gl.xformatter, gl.yformatter = LONGITUDE_FORMATTER, LATITUDE_FORMATTER
gl.xlabels_top = gl.ylabels_right = False

fig.tight_layout()
plt.show()
(Source code, png, hires.png, pdf)
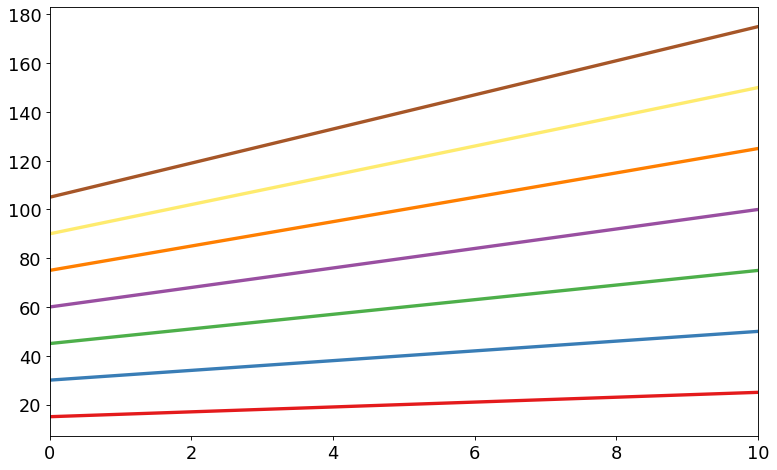
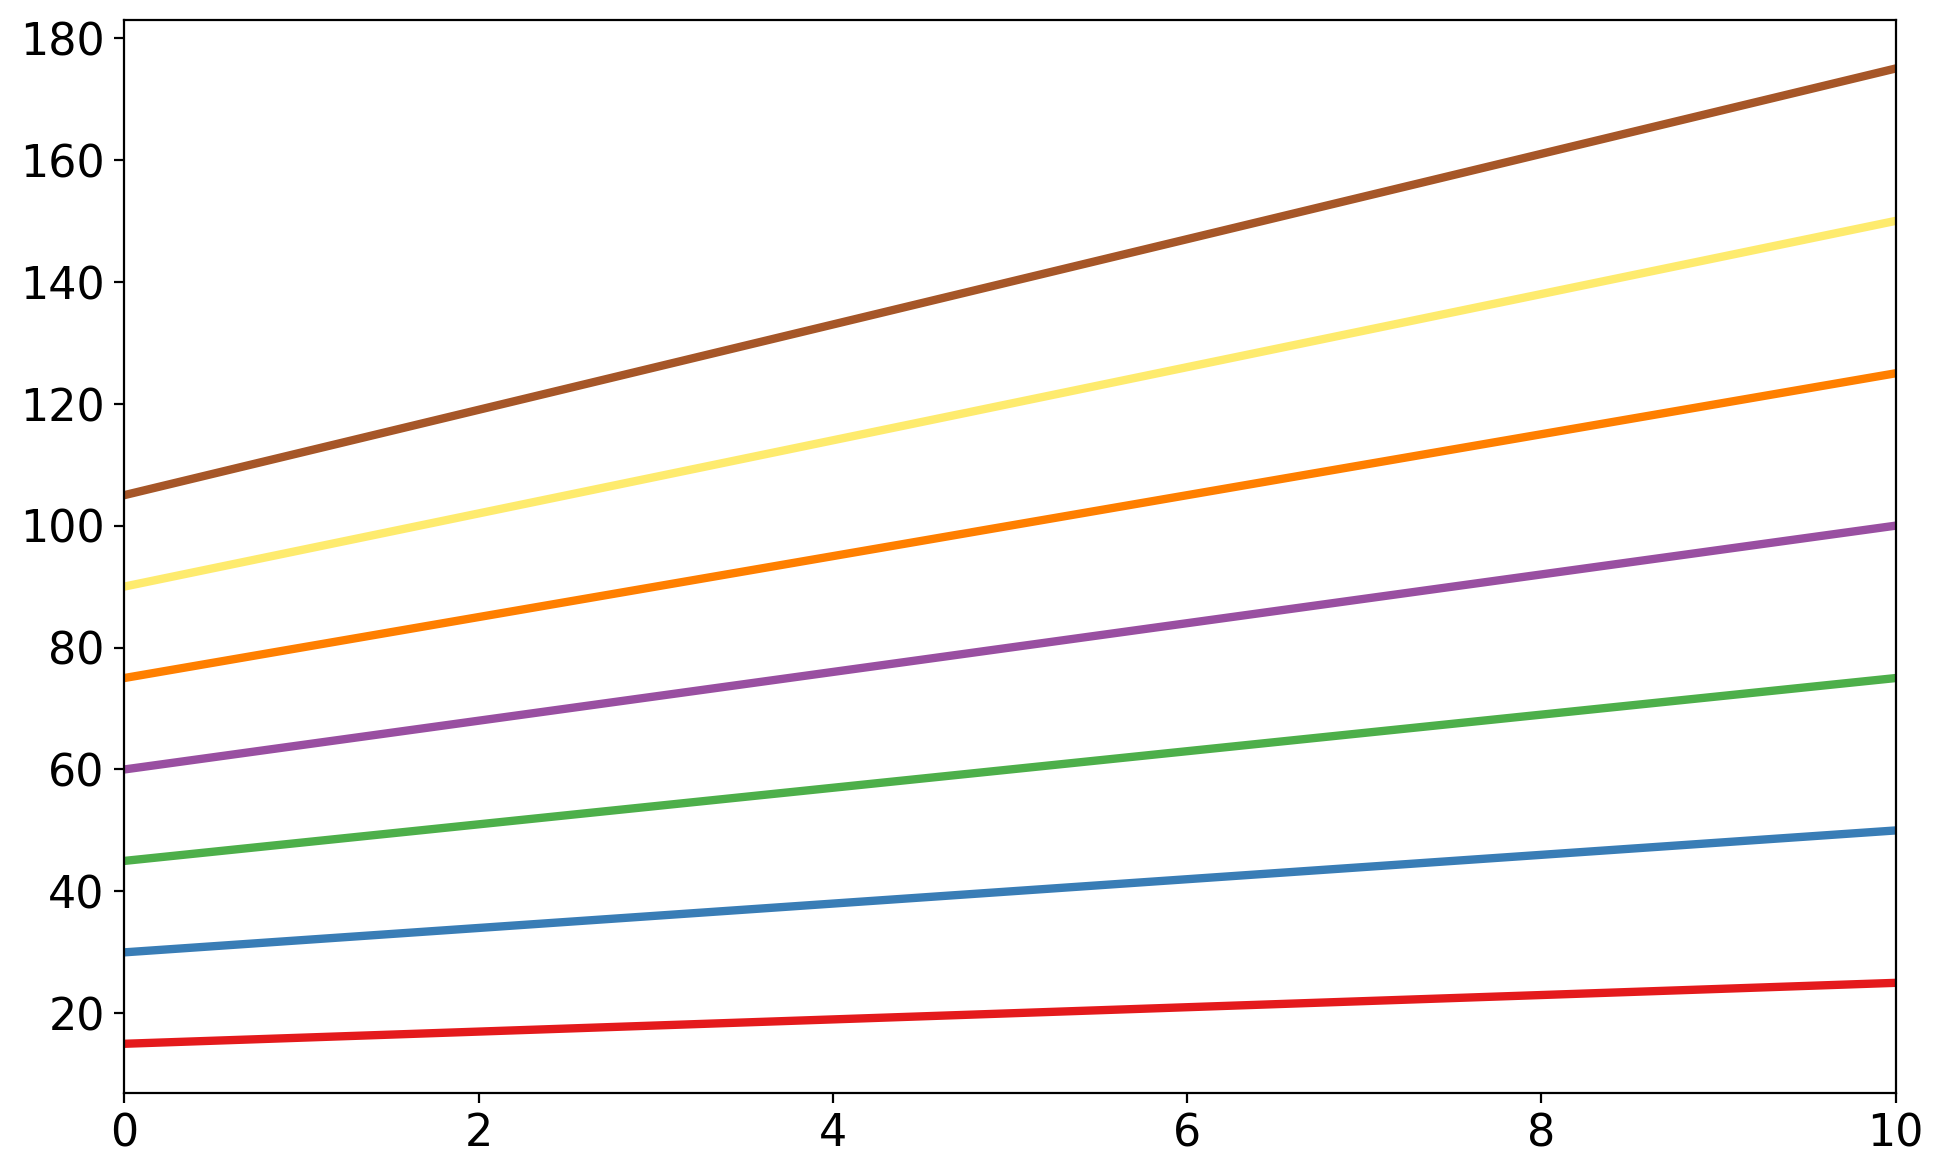
Qualitative 1
# -*- coding: utf-8 -*-

"""Plot to demonstrate the qualitative1 colormap.
"""

import numpy as np
import matplotlib.pyplot as plt

from typhon.plots import (figsize, cmap2rgba)


x = np.linspace(0, 10, 100)

fig, ax = plt.subplots(figsize=figsize(10))
ax.set_prop_cycle(color=cmap2rgba('qualitative1', 7))
for c in np.arange(1, 8):
    ax.plot(x, (15 + x) * c, linewidth=3)
ax.set_xlim(x.min(), x.max())

fig.tight_layout()
plt.show()
(Source code, png, hires.png, pdf)

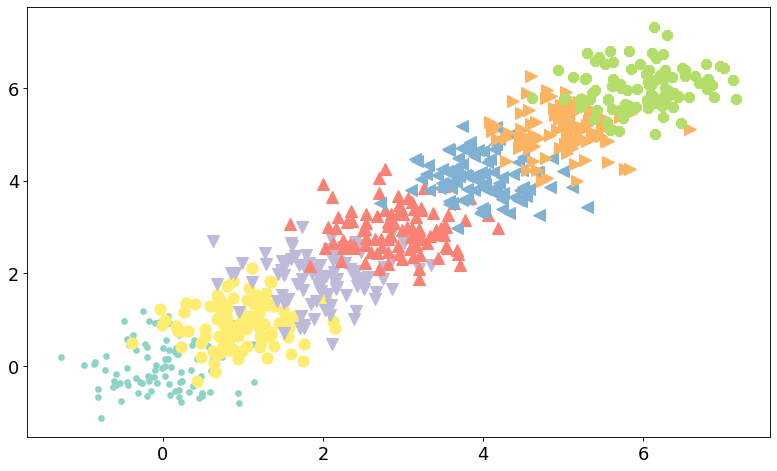
Qualitative 2
# -*- coding: utf-8 -*-

"""Plot to demonstrate the qualitative2 colormap.
"""

import numpy as np
import matplotlib.pyplot as plt
from matplotlib.lines import Line2D

from typhon.plots import (figsize, cmap2rgba)


# Create an iterator to conveniently change the marker in the following plot.
markers = (m for m in Line2D.filled_markers)

fig, ax = plt.subplots(figsize=figsize(10))
ax.set_prop_cycle(color=cmap2rgba('qualitative2', 7))
for c in np.arange(7):
    X = np.random.randn(100) / 2
    Y = np.random.randn(100) / 2
    ax.plot(X+c, Y+c, linestyle='none', marker=next(markers), markersize=10)

fig.tight_layout()
plt.show()
(Source code, png, hires.png, pdf)
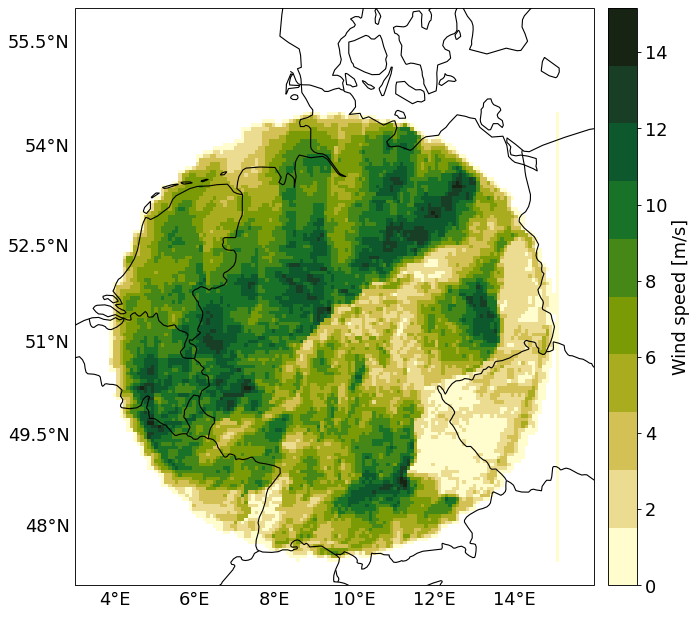
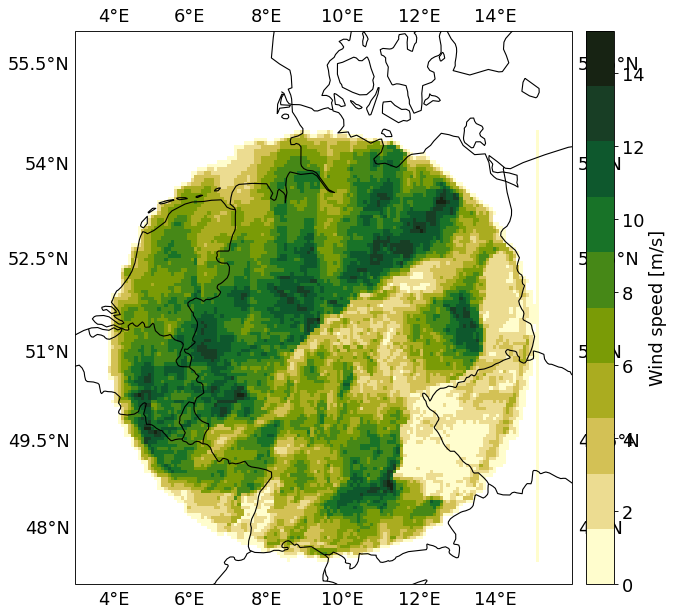
Speed
# -*- coding: utf-8 -*-
"""Plot to demonstrate the speed colormap. """

import matplotlib.pyplot as plt
import netCDF4
import numpy as np
import cartopy.crs as ccrs
from cartopy.mpl.gridliner import (LONGITUDE_FORMATTER, LATITUDE_FORMATTER)

from typhon.plots.maps import get_cfeatures_at_scale


# Read wind speed data.
with netCDF4.Dataset('_data/test_data.nc') as nc:
    lon, lat = np.meshgrid(nc.variables['lon'][:], nc.variables['lat'][:])
    u, v = nc.variables['u'][:], nc.variables['v'][:]

wspeed = np.hypot(u, v)

# Create plot with PlateCarree projection.
fig = plt.figure(figsize=(10, 8))
ax = fig.add_subplot(111, projection=ccrs.Mercator())
ax.set_extent([3, 16, 47, 56])

# Add map "features".
features = get_cfeatures_at_scale(scale='50m')
ax.add_feature(features.BORDERS)
ax.add_feature(features.COASTLINE)

# Plot the actual data.
sm = ax.pcolormesh(lon, lat, wspeed,
                   cmap=plt.get_cmap('speed', lut=10),
                   rasterized=True,
                   transform=ccrs.PlateCarree(),
                   )

fig.colorbar(sm, label='Wind speed [m/s]', fraction=0.05, pad=0.02)

# Add coordinate system without drawing gridlines.
gl = ax.gridlines(draw_labels=True, color='none')
gl.xformatter, gl.yformatter = LONGITUDE_FORMATTER, LATITUDE_FORMATTER
gl.xlabels_top = gl.ylabels_right = False

fig.tight_layout()
plt.show()
(Source code, png, hires.png, pdf)
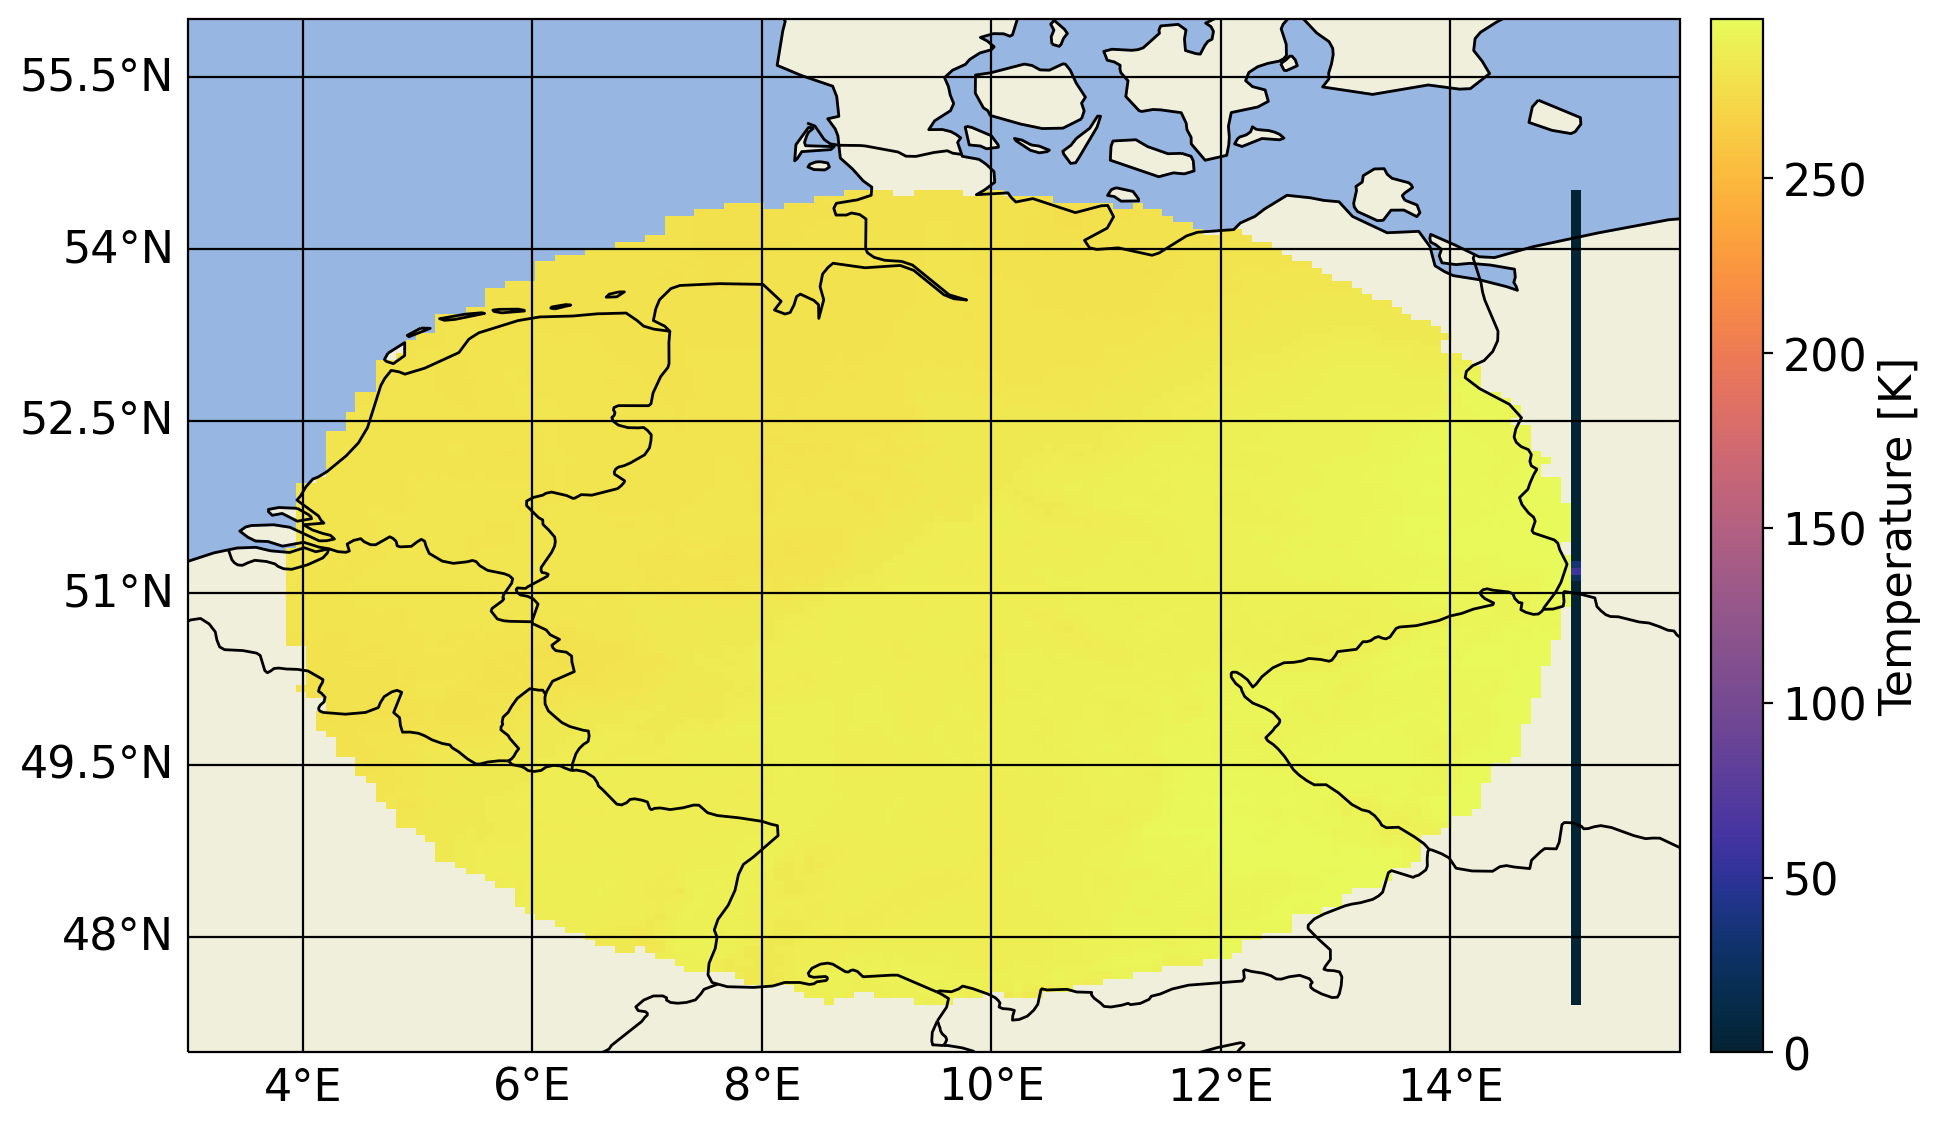
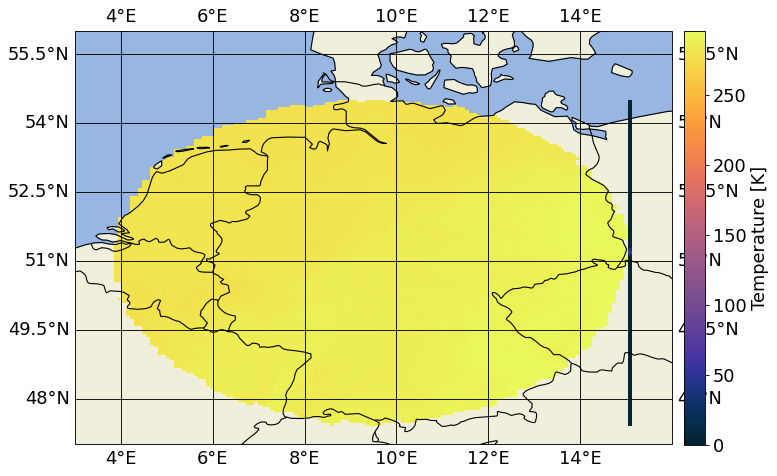
Temperature
# -*- coding: utf-8 -*-
"""Plot to demonstrate the temperature colormap. """

import matplotlib.pyplot as plt
import netCDF4
import numpy as np
import cartopy.crs as ccrs
from cartopy.mpl.gridliner import (LONGITUDE_FORMATTER, LATITUDE_FORMATTER)

from typhon.plots.maps import get_cfeatures_at_scale


# Read air temperature data.
with netCDF4.Dataset('_data/test_data.nc') as nc:
    lon, lat = np.meshgrid(nc.variables['lon'][:], nc.variables['lat'][:])
    temp = nc.variables['temp'][:]

# Create plot with PlateCarree projection.
fig = plt.figure(figsize=(10, 8))
ax = fig.add_subplot(111, projection=ccrs.PlateCarree())
ax.set_extent([3, 16, 47, 56])

# Add map "features".
features = get_cfeatures_at_scale(scale='50m')
ax.add_feature(features.BORDERS)
ax.add_feature(features.COASTLINE)
ax.add_feature(features.LAND)
ax.add_feature(features.OCEAN)

# Plot the actual data.
sm = ax.pcolormesh(lon, lat, temp,
                   cmap='temperature',
                   rasterized=True,
                   transform=ccrs.PlateCarree(),
                   )
fig.colorbar(sm, label='Temperature [K]', fraction=0.0328, pad=0.02)

# Add grids and coordinate system.
gl = ax.gridlines(draw_labels=True, color='black')
gl.xformatter, gl.yformatter = LONGITUDE_FORMATTER, LATITUDE_FORMATTER
gl.xlabels_top = gl.ylabels_right = False

fig.tight_layout()
plt.show()
(Source code, png, hires.png, pdf)
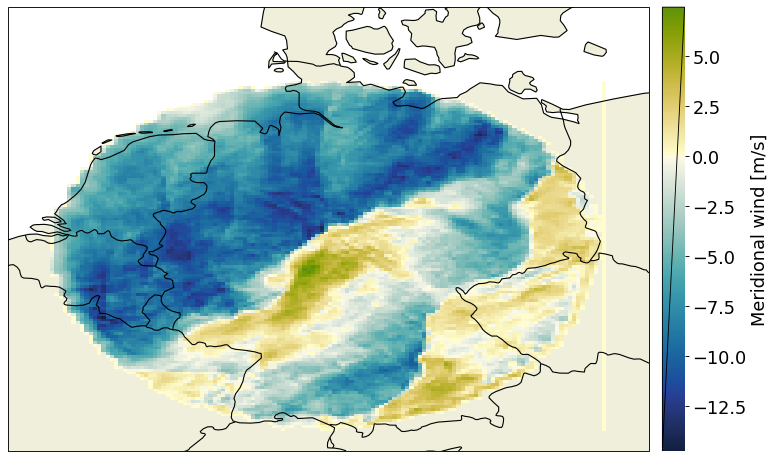
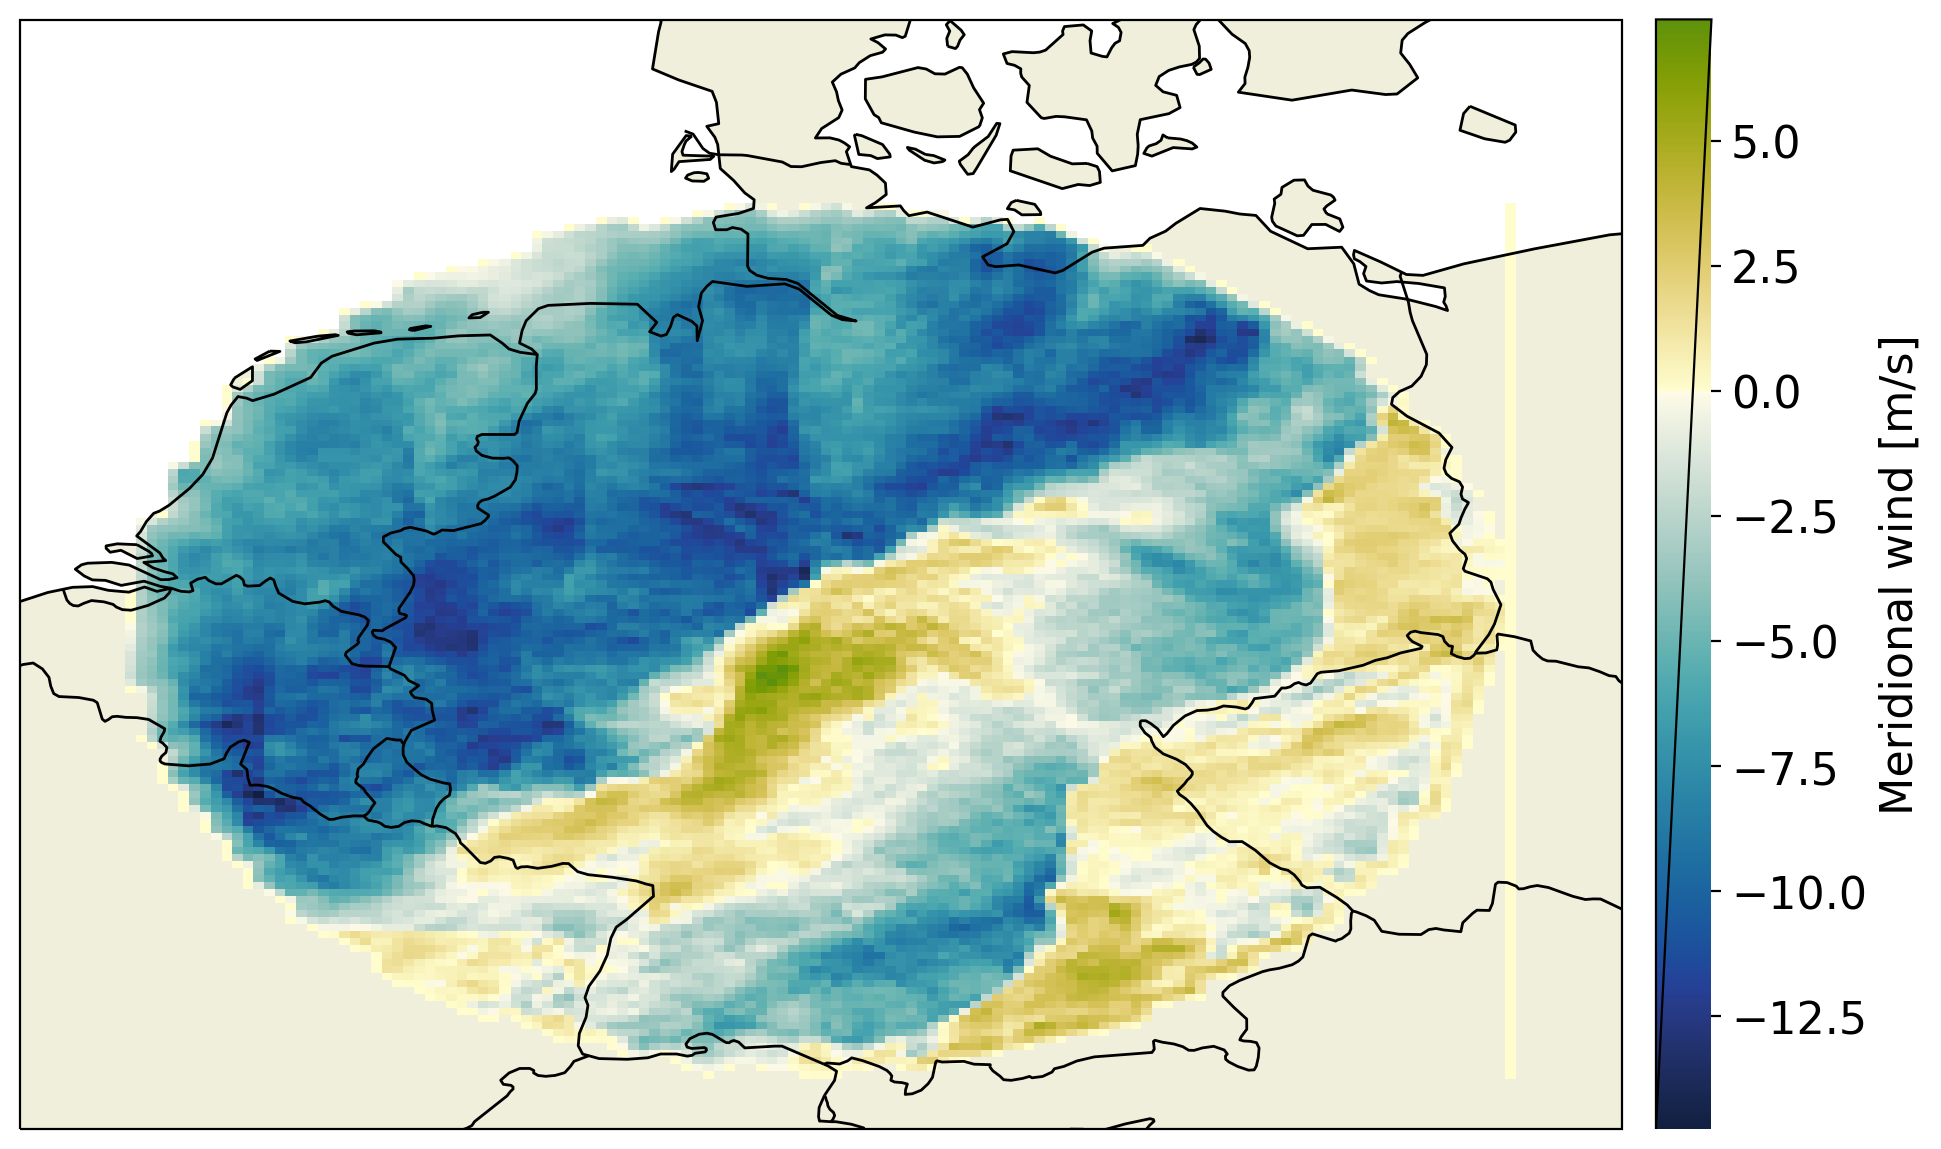
Velocity
# -*- coding: utf-8 -*-
"""Plot to demonstrate the velocity colormap. """

import matplotlib.pyplot as plt
import netCDF4
import numpy as np
import cartopy.crs as ccrs

from typhon.plots import (center_colorbar, get_cfeatures_at_scale)


# Read wind speed data.
with netCDF4.Dataset('_data/test_data.nc') as nc:
    lon, lat = np.meshgrid(nc.variables['lon'][:], nc.variables['lat'][:])
    v = nc.variables['v'][:]

# Create plot with PlateCarree projection.
fig = plt.figure(figsize=(10, 8))
ax = fig.add_subplot(111, projection=ccrs.PlateCarree())
ax.set_extent([3, 16, 47, 56])

# Add map "features".
features = get_cfeatures_at_scale(scale='50m')
ax.add_feature(features.COASTLINE)
ax.add_feature(features.BORDERS)
ax.add_feature(features.LAND)

# Plot the actual data.
sm = ax.pcolormesh(lon, lat, v,
                   cmap='velocity',
                   rasterized=True,
                   transform=ccrs.PlateCarree(),
                   )

cb = fig.colorbar(sm, label='Meridional wind [m/s]', fraction=0.0328, pad=0.02)
center_colorbar(cb)

fig.tight_layout()
plt.show()
(Source code, png, hires.png, pdf)

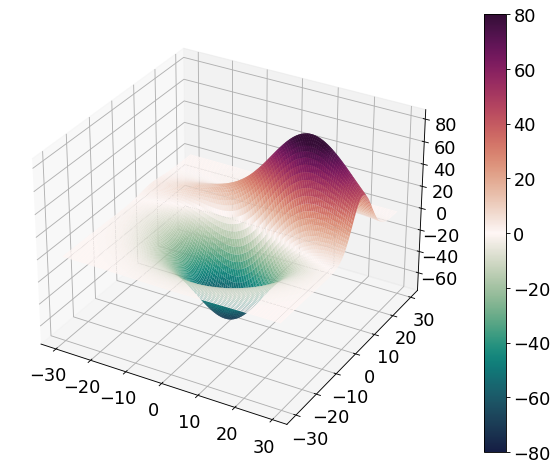
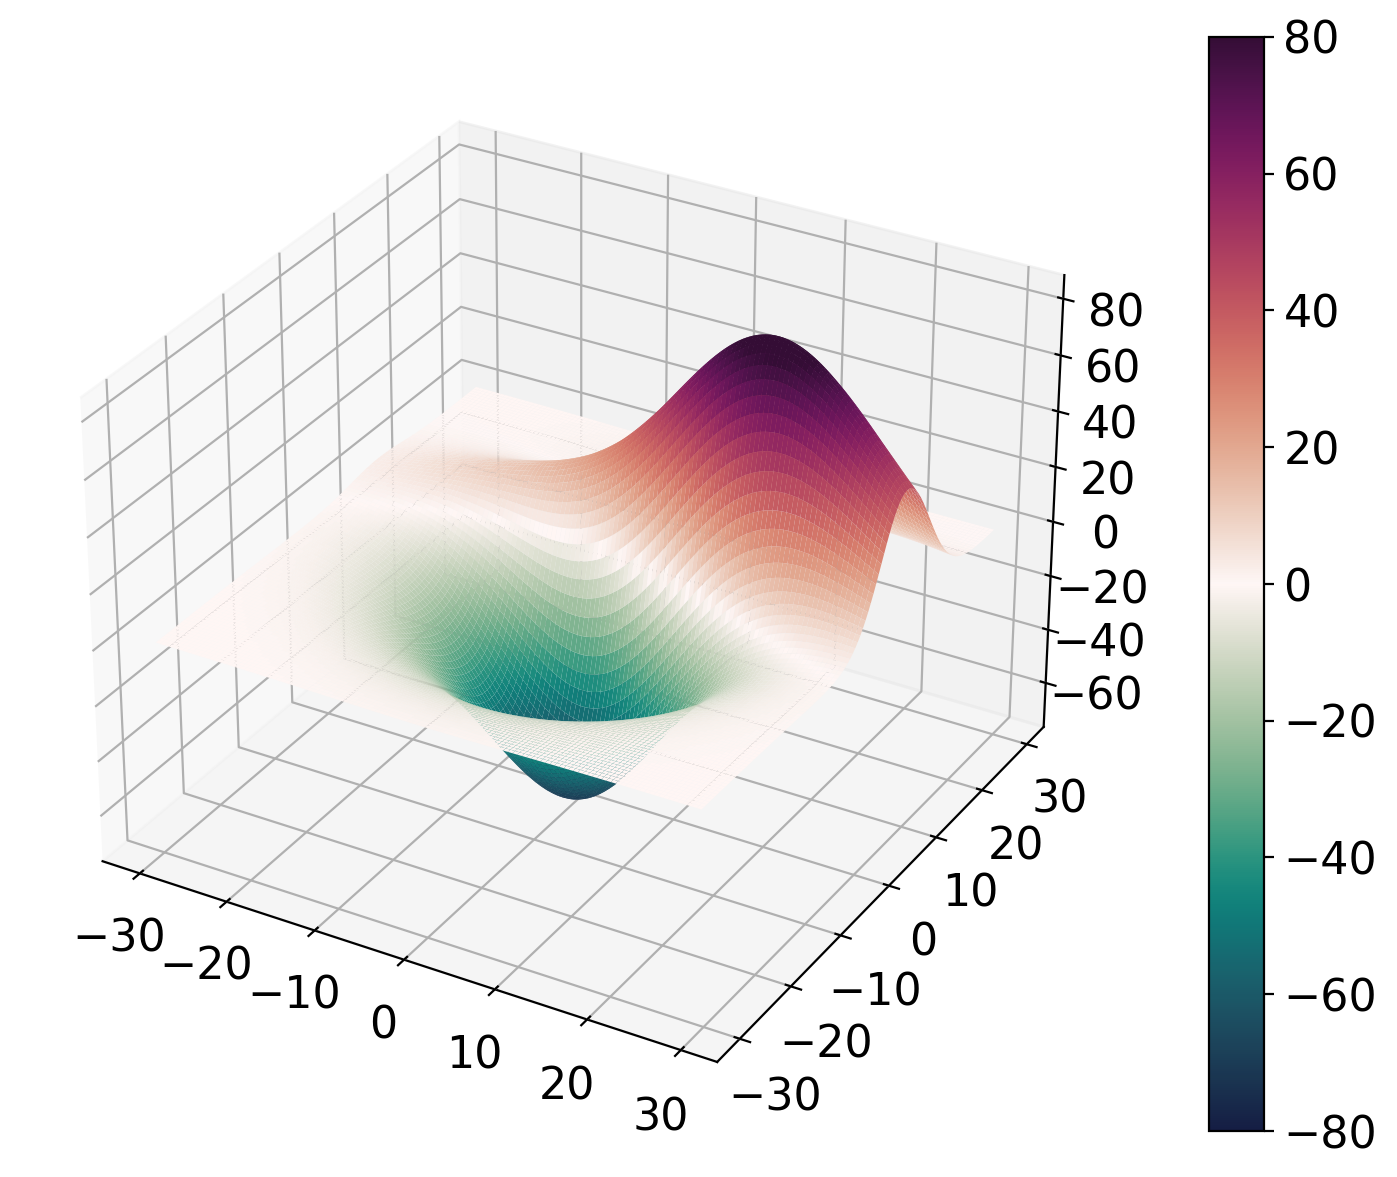
Vorticity
# -*- coding: utf-8 -*-

"""Plot to demonstrate the vorticity colormap.
"""

from mpl_toolkits.mplot3d import axes3d
import matplotlib.pyplot as plt

from typhon.plots import figsize

fig = plt.figure(figsize=figsize(10))
ax = fig.gca(projection='3d')
X, Y, Z = axes3d.get_test_data(0.05)
surf = ax.plot_surface(X, Y, Z, cmap='vorticity', vmin=-80, vmax=80,
                       rstride=1, cstride=1, linewidth=0)
fig.colorbar(surf)
fig.tight_layout()
plt.show()
(Source code, png, hires.png, pdf)
