channels
- typhon.plots.channels(met_mm_backend, ylim=None, ax=None, **kwargs)[source]
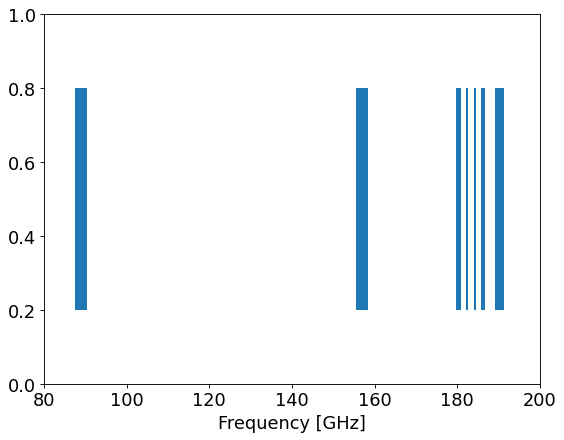
Plot instrument channels for passband-type sensors.
- Parameters
met_mm_backend (ndarray) – Backend description for meteorological millimeter sensors with passbands (met_mm_backend).
ylim (tuple) – A tuple-like container with the lower and upper y-limits for the rectangles.
ax (AxesSubplot) – Axes to plot in.
**kwargs – Additional keyword arguments passed to
Rectangle.
- Returns
List of all rectangles drawn.
- Return type
Note
matplotlib.patches.Patchdo not set the axis limits. If this function is used without other data in the plot, you have to set the axis limits to an appropriate value. Otherwise the drawn channels might not be seen.Examples:
import numpy as np
import matplotlib.pyplot as plt
import typhon.plots

met_mm_backend = np.array([
    [89.000e9, 0., 0., 2800e6],
    [157.000e9, 0., 0., 2800e6],
    [183.311e9, 1.00e9, 0., 500e6],
    [183.311e9, 3.00e9, 0., 1000e6],
    [190.311e9, 0., 0., 2200e6],
    ])

fig, ax = plt.subplots(figsize=(8, 6))
typhon.plots.channels(met_mm_backend / 1e9, ylim=(0.2, 0.8))
ax.set_xlim(80, 200)  # mpl.patches do **not** autoscale axis limits!
ax.set_xlabel('Frequency [GHz]')

plt.show()
(Source code, png, hires.png, pdf)