ScalingFormatter
- typhon.plots.ScalingFormatter(scaling=1, fmtstr='{x:g}')[source]
Provide a ticklabel formatter that applies scaling.
- Parameters
- Returns
Formatter.
- Return type
Examples:
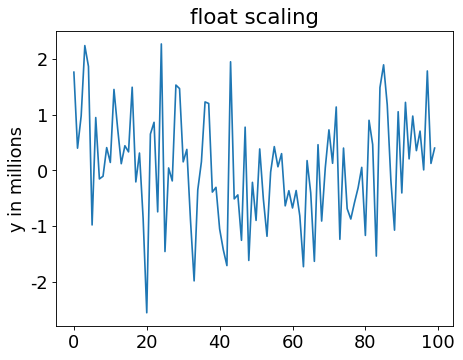
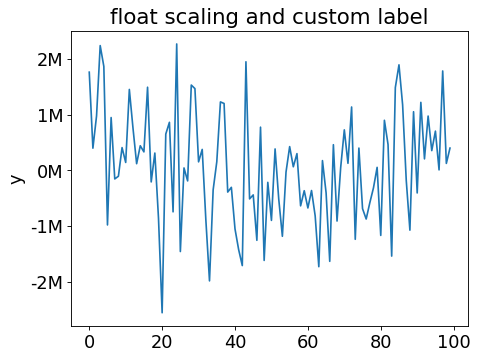
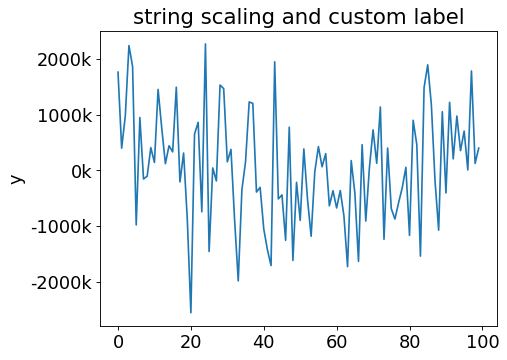
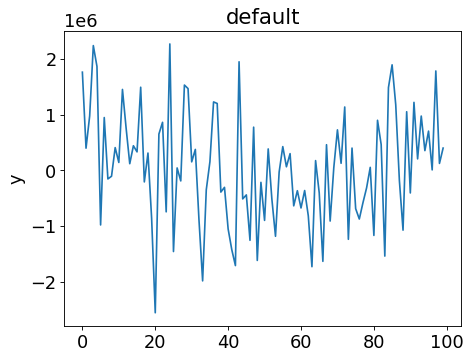
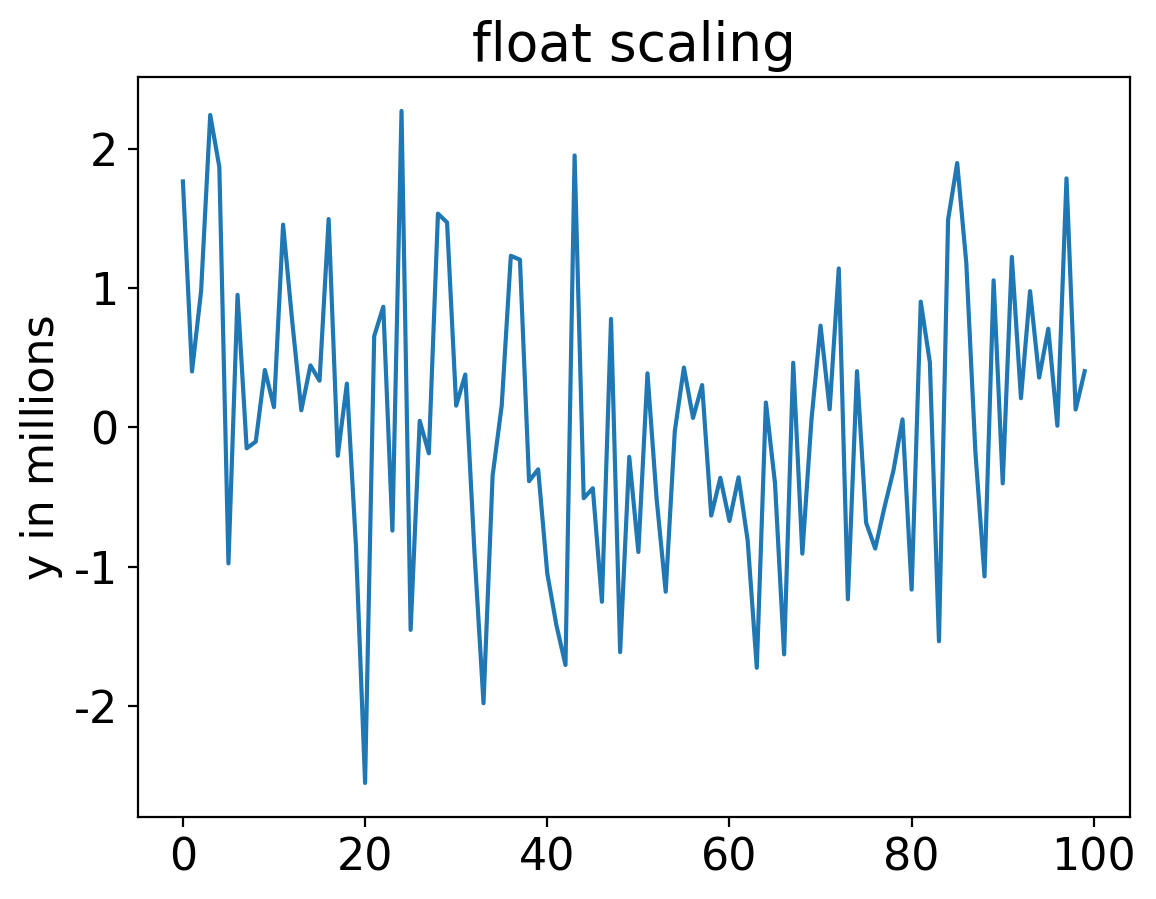
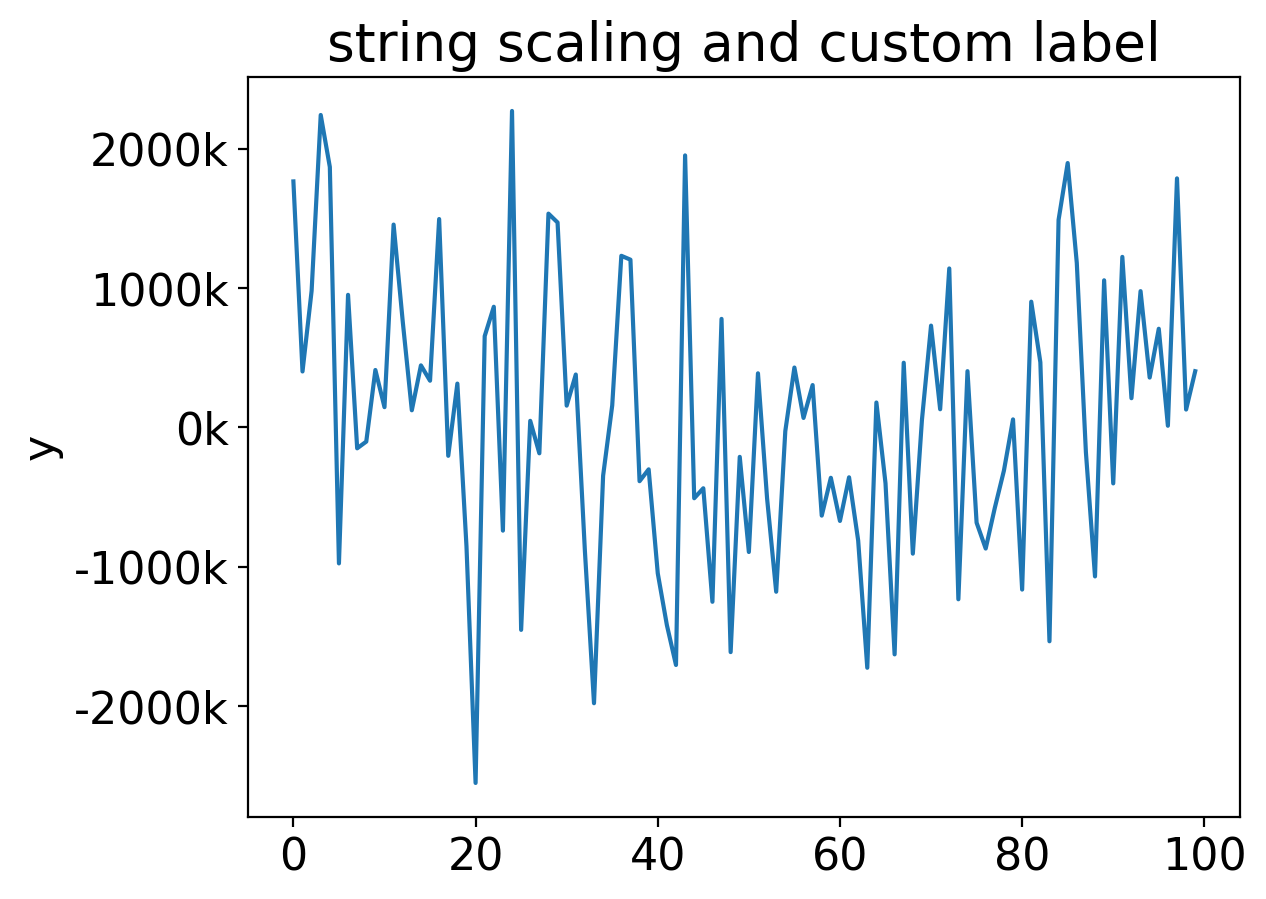
import numpy as np
import matplotlib.pyplot as plt
from typhon.plots import (set_yaxis_formatter, ScalingFormatter)


y = 1e6 * np.random.randn(100)

fig, ax = plt.subplots()
ax.plot(y)
ax.set_ylabel('y')
ax.set_title('default')

fig, ax = plt.subplots()
ax.plot(y)
set_yaxis_formatter(ScalingFormatter(scaling=1e6))
ax.set_ylabel('y in millions')
ax.set_title('float scaling')

fig, ax = plt.subplots()
ax.plot(y)
set_yaxis_formatter(ScalingFormatter(scaling=1e6, fmtstr='{x:g}M'))
ax.set_ylabel('y')
ax.set_title('float scaling and custom label')

fig, ax = plt.subplots()
ax.plot(y)
set_yaxis_formatter(ScalingFormatter(scaling='kilo', fmtstr='{x:g}k'))
ax.set_ylabel('y')
ax.set_title('string scaling and custom label')

plt.show()
